Serendipity. Let’s talk numbers…
A guest blog post by Abigail McBirnie, who completed her PhD at Aberystwyth University in December 2012. Her thesis examined networked and quantitative aspects of serendipity. She can be contacted on amcbirnie at googlemail dot com.
Back in October 2012 at a meeting of IxDA London, I had the good fortune of hearing two talks on serendipity, one by Oli Shaw on serendipity and big data, and the other, by SerenA’s very own Stephann Makri . Stephann’s talk focused on what the SerenA project has learned from studying ‘serendipity stories’, first person accounts of experiences of serendipity in research.
During the discussion session that followed Stephann’s talk, one question from the audience really made me sit up: ‘Can you give us any quantitative data or findings?’ In other words, what about the numbers in serendipity?
This question caught my attention because I have just wrapped up 4+ years of PhD work describing quantitative aspects of serendipity experiences in research. So, as you can imagine, I’ve been asking some very specific questions about the numbers in serendipity stories!
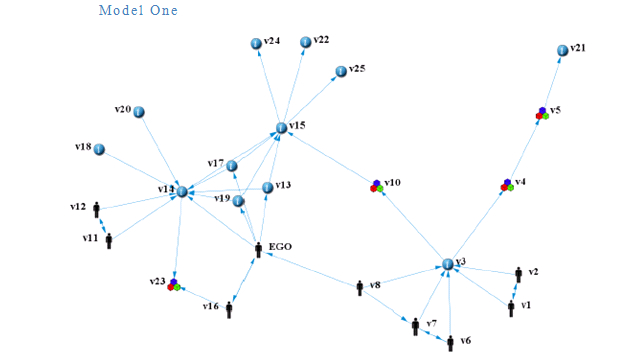
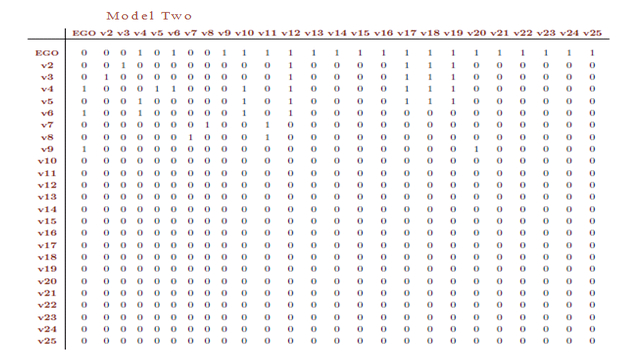
My research took a random sample of fifty serendipity stories held in the Citation Classics online dataset and, using two different relational text analysis approaches, translated each sample story into a pair of network models described qualitatively as network visualisations
and quantitatively as network matrices.
This approach resulted in 100 network models (50 pairs), data that were then analysed quantitatively using a combination of network analysis methods, traditional statistical techniques and inferential statistical network modelling approaches. As you can probably deduce from this rather broad-brush overview, the study produced a lot of detailed, quantitative information about serendipity. Numbers galore!!
But, some of you might wonder, why it is important to do research on the numbers in serendipity? Why do we need them? Indeed, others may even take issue point blank with the premise of asking quantitative questions about a personal, lived and experienced phenomenon such as serendipity.
My response to the latter point is simple: as serendipity researchers, we already make quantitative assumptions about serendipity. For example, one claim that tends to pop up time and time again in discussions of serendipity is that having ‘a lot of connections’ is helpful for serendipity. This idea of ‘a lot’ underlies an explicitly quantitative question: how many?
Another issue pondered by serendipity researchers is the matter of pull versus push, activity versus passivity, ‘doing’ versus ‘happening to’ in serendipity. Again, when we seek to explore the distribution between these—for example, whether one features more than the other in serendipity—we are highlighting quantitative concerns.
As to why we should ask questions about the numbers in serendipity stories, several reasons present.
Certainly, a key contemporary application area for serendipity research is the design of so-called ‘serendipity systems’, the holy grail of apps, platforms, technology and software engineered to encourage or enable serendipity. Although, given what we already know about serendipity, the simplistic idea of ‘control’ of serendipity in such systems seems old fashioned, the more flexible ideas of structure, order, links, connections and the balance between variable and fixed elements still have relevance and merit. Numbers could help us to translate these useful yet fuzzy ideas into concrete designs and applications.
For example, my research found that, on average, people made up one third of the participants (the nodes illustrated by person thumbnails in the networks illustrated above) of a serendipity story, where the remaining participants were deemed to be either information or physical objects. This is practical information of potential value to a designer of a serendipity system: if, say, ten participants are somehow simulated, engineered or factored into a system, then it might be a useful starting point, although by no means any guarantee for serendipity—remember that control is too simplistic a concept—to allow or arrange for around three of these participants to be people.
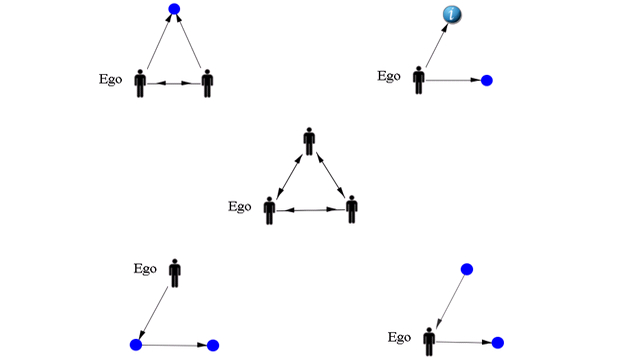
Another finding of the research, reported partially in McBirnie and Urquhart (2011), was the presence of motifs across the serendipity stories. These repeated patterns of links between three serendipity story participants provide complex quantitative information: the motifs represent the structures of relational links between people, objects and information that appear most frequently across the stories.
(In this figure, nodes illustrated by thumbnail images have fixed attributes [e.g. person, information], while nodes illustrated by blue dots have variable attributes [i.e. they can be people, physical objects or information]. ‘Ego’ is the person who experiences the serendipity.)
The presence of motifs raises intriguing questions about the possibility of normal social roles in serendipity—in other words, interaction patterns that could be considered normal for serendipity, irrespective of the specifics of context or setting.
Anyone familiar with the ideas behind the role census, a collection of generic social role descriptions, mini-networks described by the linking patterns between three ‘role participants’, may see some possible potential in the motif findings for serendipity systems design. If the motifs represent normal roles in serendipity, then could we somehow engineer these motifs into serendipity systems?
Aside from direct applications to serendipity systems, there are other reasons to care about the numbers in serendipity stories.
Numbers help us to check underlying theoretical assumptions that inform our designs. Take, for example, the assumption mentioned earlier about having ‘a lot of connections’ in serendipity. The numbers from my study suggest that the validity of this assumption varies with the perspective we adopt—that is, whether we view serendipity in terms of global, overall connections (i.e. as the complete network of a serendipity story) or only in terms of the local connections to or from the person experiencing serendipity (i.e. as ego’s direct links in that serendipity story network).
Certainly, across the serendipity examples I studied, the numbers of overall connections had high statistical variability; in other words, the numbers did not cluster closely around a single value we could conveniently label ‘a lot’. However, in complete contrast, the relative (i.e. normalised to allow comparison across networks of different sizes) local connections to and from ego displayed statistical normality and centred on a value that was significantly higher, ‘a lot’ more, than the comparable value for the local connections not involving ego. Clearly, when we consider connections in serendipity, the distinction between global and local matters.
Knowing more about the numbers in serendipity stories also ultimately helps us to understand serendipity as a complex phenomenon. Because complexity inherently comprises detail, knowledge of detail can, in turn, support complex understanding. For example, in music, one studies the chord progression of a piece to better understand the complexity of what one is hearing. Similarly, in literature, one studies the turn of phrase employed by an author to better understand the complexity of what one is reading.
So it should be with the study of serendipity: we need all the detail we can get our hands on, both qualitative and quantitative, to help our theories and the designs that grow from them to mature.
(All images above derive from: McBirnie, A. (2012). A Descriptive Profile of Process in Serendipity: A Narrative and Network Study of Information Behaviour in Context, PhD thesis, Aberystwyth University, Aberystwyth. The network visualisations were drawn using Kathleen Carley’s ORA software.)
- October 25, 2013ESRC Science Festival and SerenA(0) Comments
- April 9, 2013Serendipity. Let's talk numbers...(0) Comments
- April 3, 2013Second-hand serendipity?(1) Comments
- March 27, 2013The Princes of Serendip(0) Comments
- March 19, 2013Serendipity Salon Workshop at Future Everything. 21st March, 2013(0) Comments
- March 13, 2013March Events: Serendipity Symposium(0) Comments


Social Media